Intro
Reforge Insights automatically generates feedback reports based on your customer feedback ingested into the workspace. Reports can save you the time spent on tagging, sorting and analyzing feedback and tickets manually; instead, we provide a real-time feedback report that provides comprehensive and integrated analysis automatically with top themes and trends.How is the report generated?
When you ingest your data to Reforge Insights, our AI models will organize the feedback data, identify themes by grouping related data points, analyze them, and generate a report for each theme automatically.Time period and filter
The reports will default to show analysis based on all feedback. You can select time period to narrow your focus. You can also use filters to select specific feedback by “Category”, “Priority”, “Tag”, “Status” and “Source”.
Chart
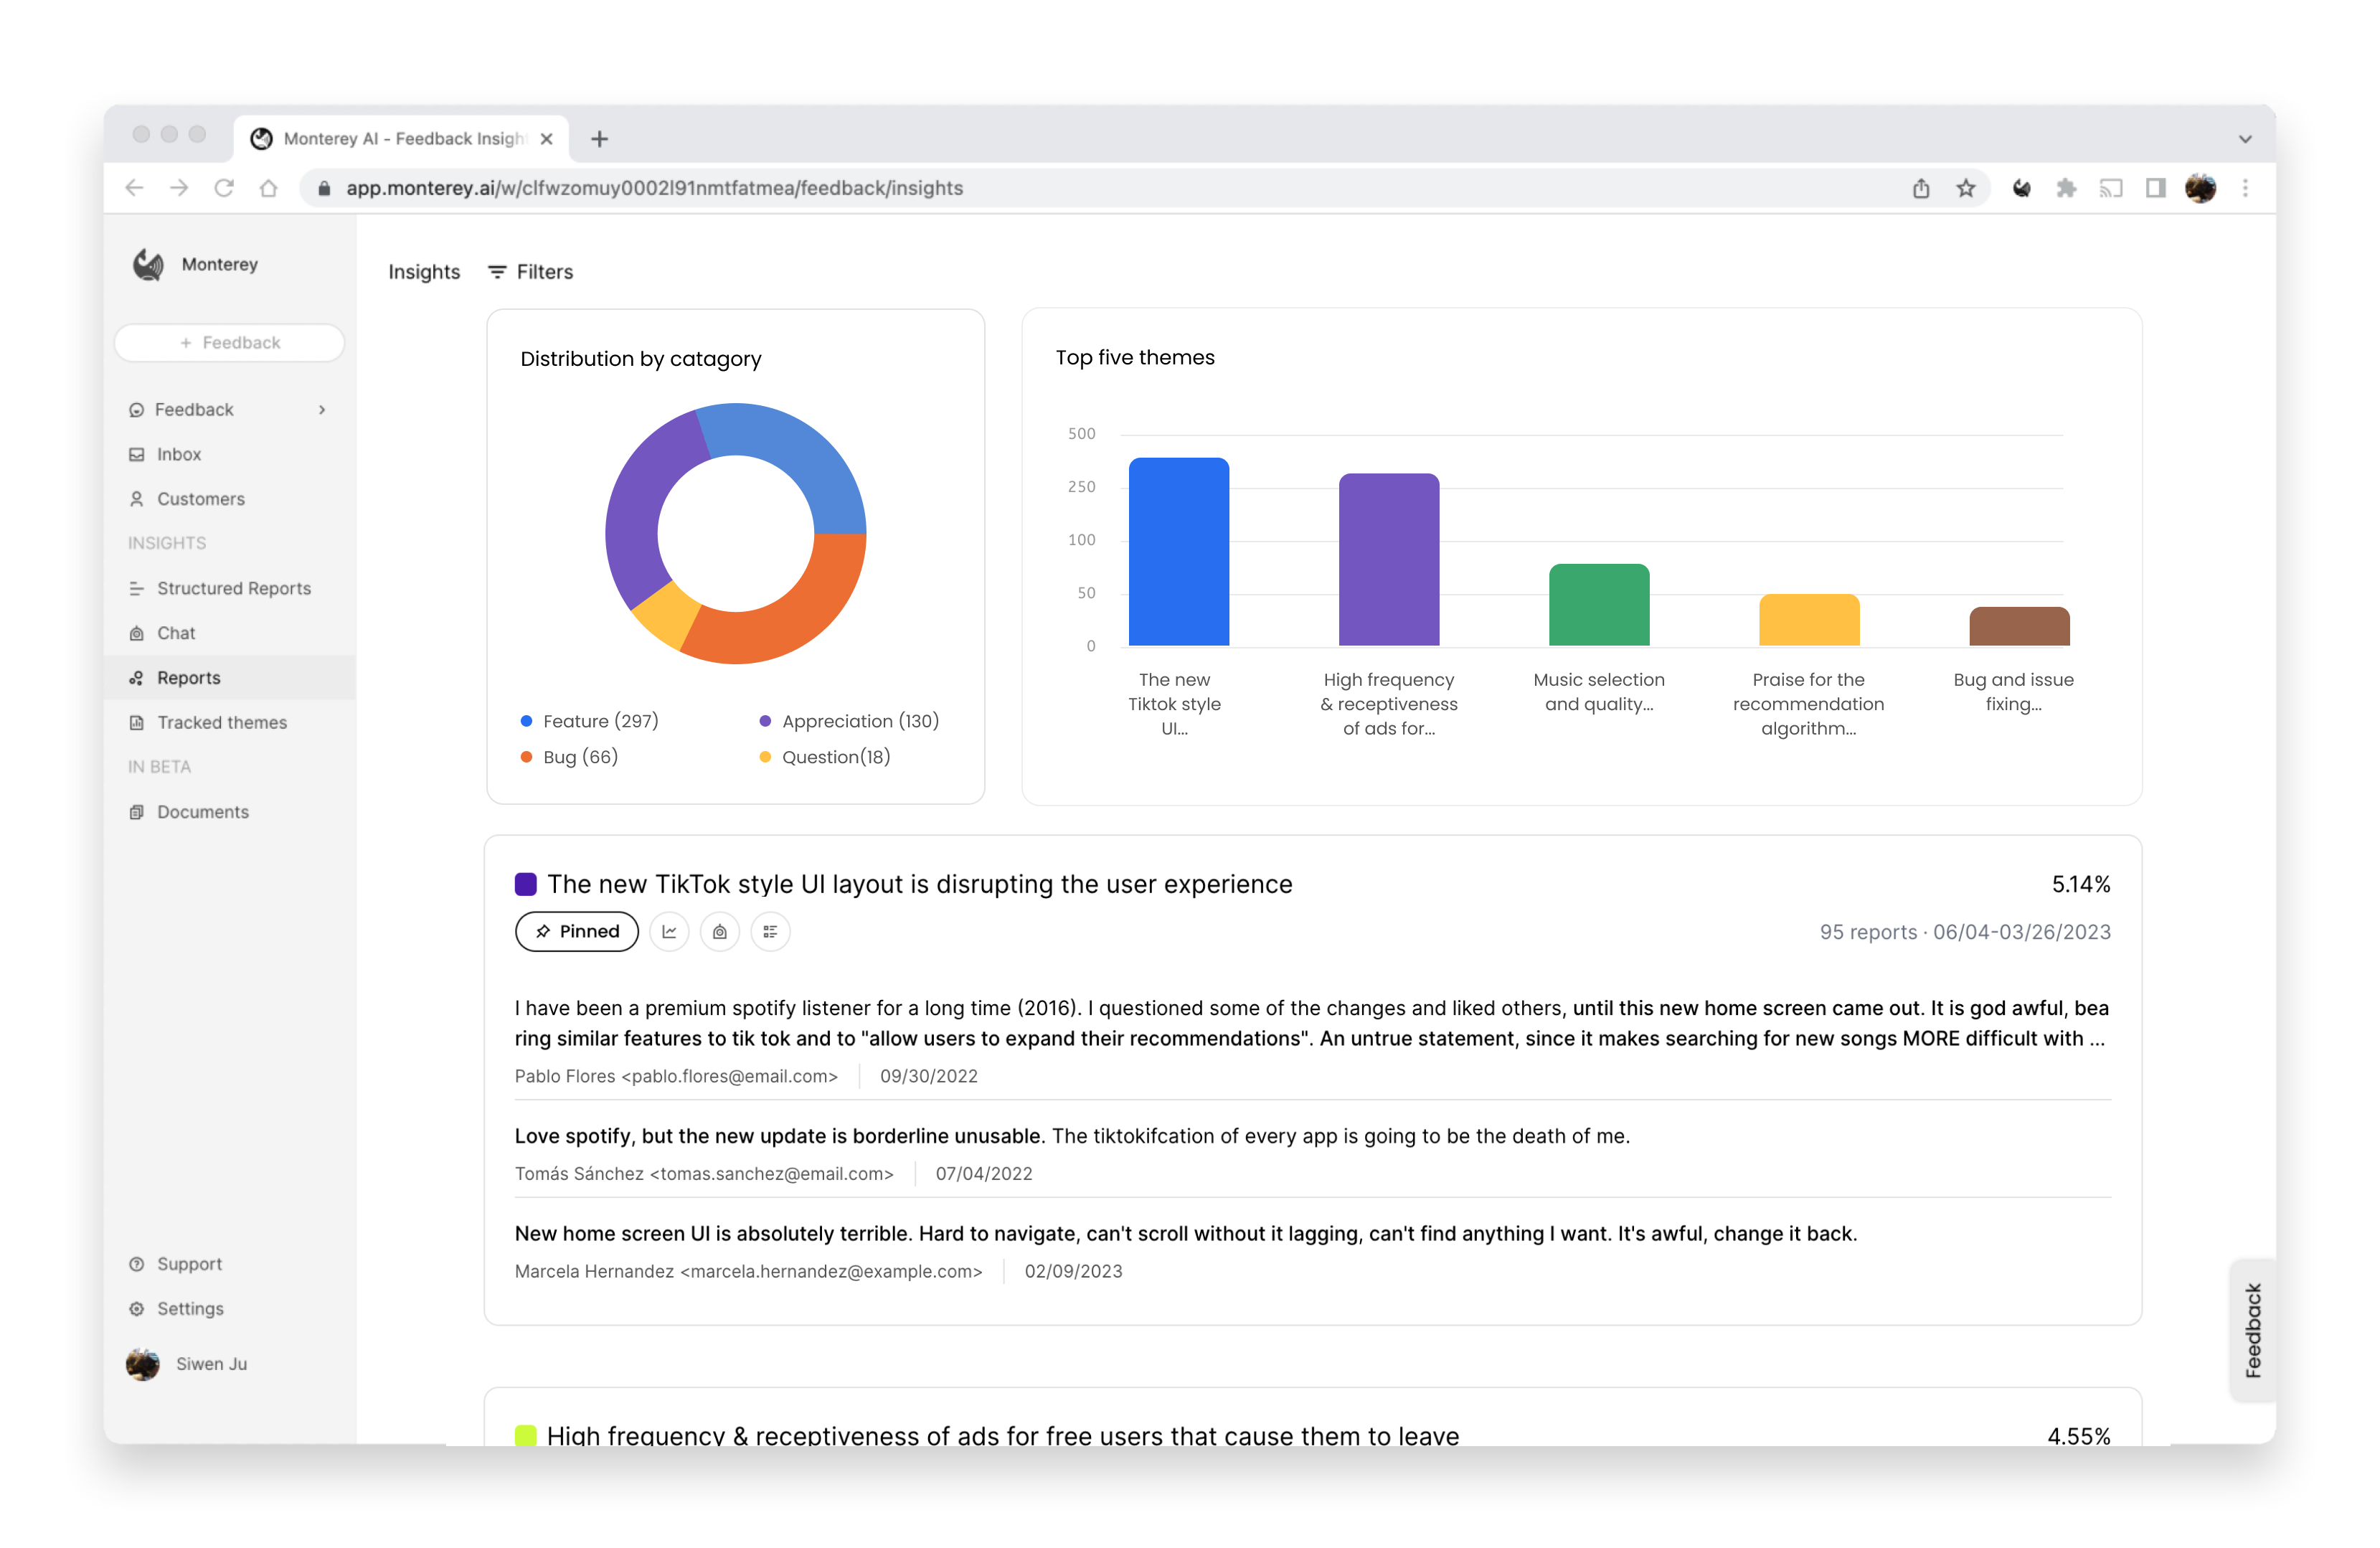
Reforge Insights auto-categorizes feedback as “Bug”, “Feature”, “Question”, “Appreciation” and uses these for report analysis. You will be able to see a distribution infographic that reveals what type of issues your customers have.Themes and actions
The report is ranked according to the popularity of the feedback themes (the number of user reports). Each theme contains all of the feedback reports related to that theme. You can access all relevant feedback by clicking on the all feedback button. In addition, advanced features like “Trends” and “Idea generation” can further help you understand each feedback theme.
Tracked themes and advance actions
Any theme listed in the report can be tracked by clicking on the “Pin” button. The pinned theme will be saved in the Tracked theme tab. Tracked themes are able to take further actions such as creating tickets, assigning owners, and tracking progress.