Intro
The themes reports in Reforge Insights provide a high-level overview of the most common topics and trends in your feedback data. Each theme is produced by grouping together data with some similar element(s) in the raw text content of the feedback. The report is designed to help you understand the most common themes in your feedback, so you can prioritize your product roadmap and make data-driven decisions.Themes Reports
By default, the system will create an ongoing report based on all of the feedback data in your workspace. This will be updated daily, if there is enough new volume since the last time it was updated. You can also create additional, one-time themes reports based on a specific subset of your feedback data. This can be useful if you want to focus on a specific product, feature, or customer segment. To do so, you can navigate to the Snippets list view, apply any filters you’d like, and then click the action menu and then “Create Report”. This report will not automatically update, but can be refreshed as needed, if there is sufficient new data matching the reports’ filters.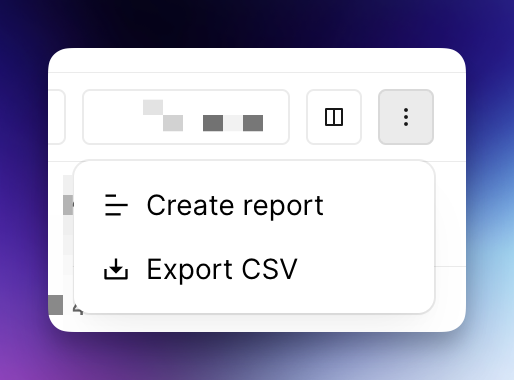
Themes List
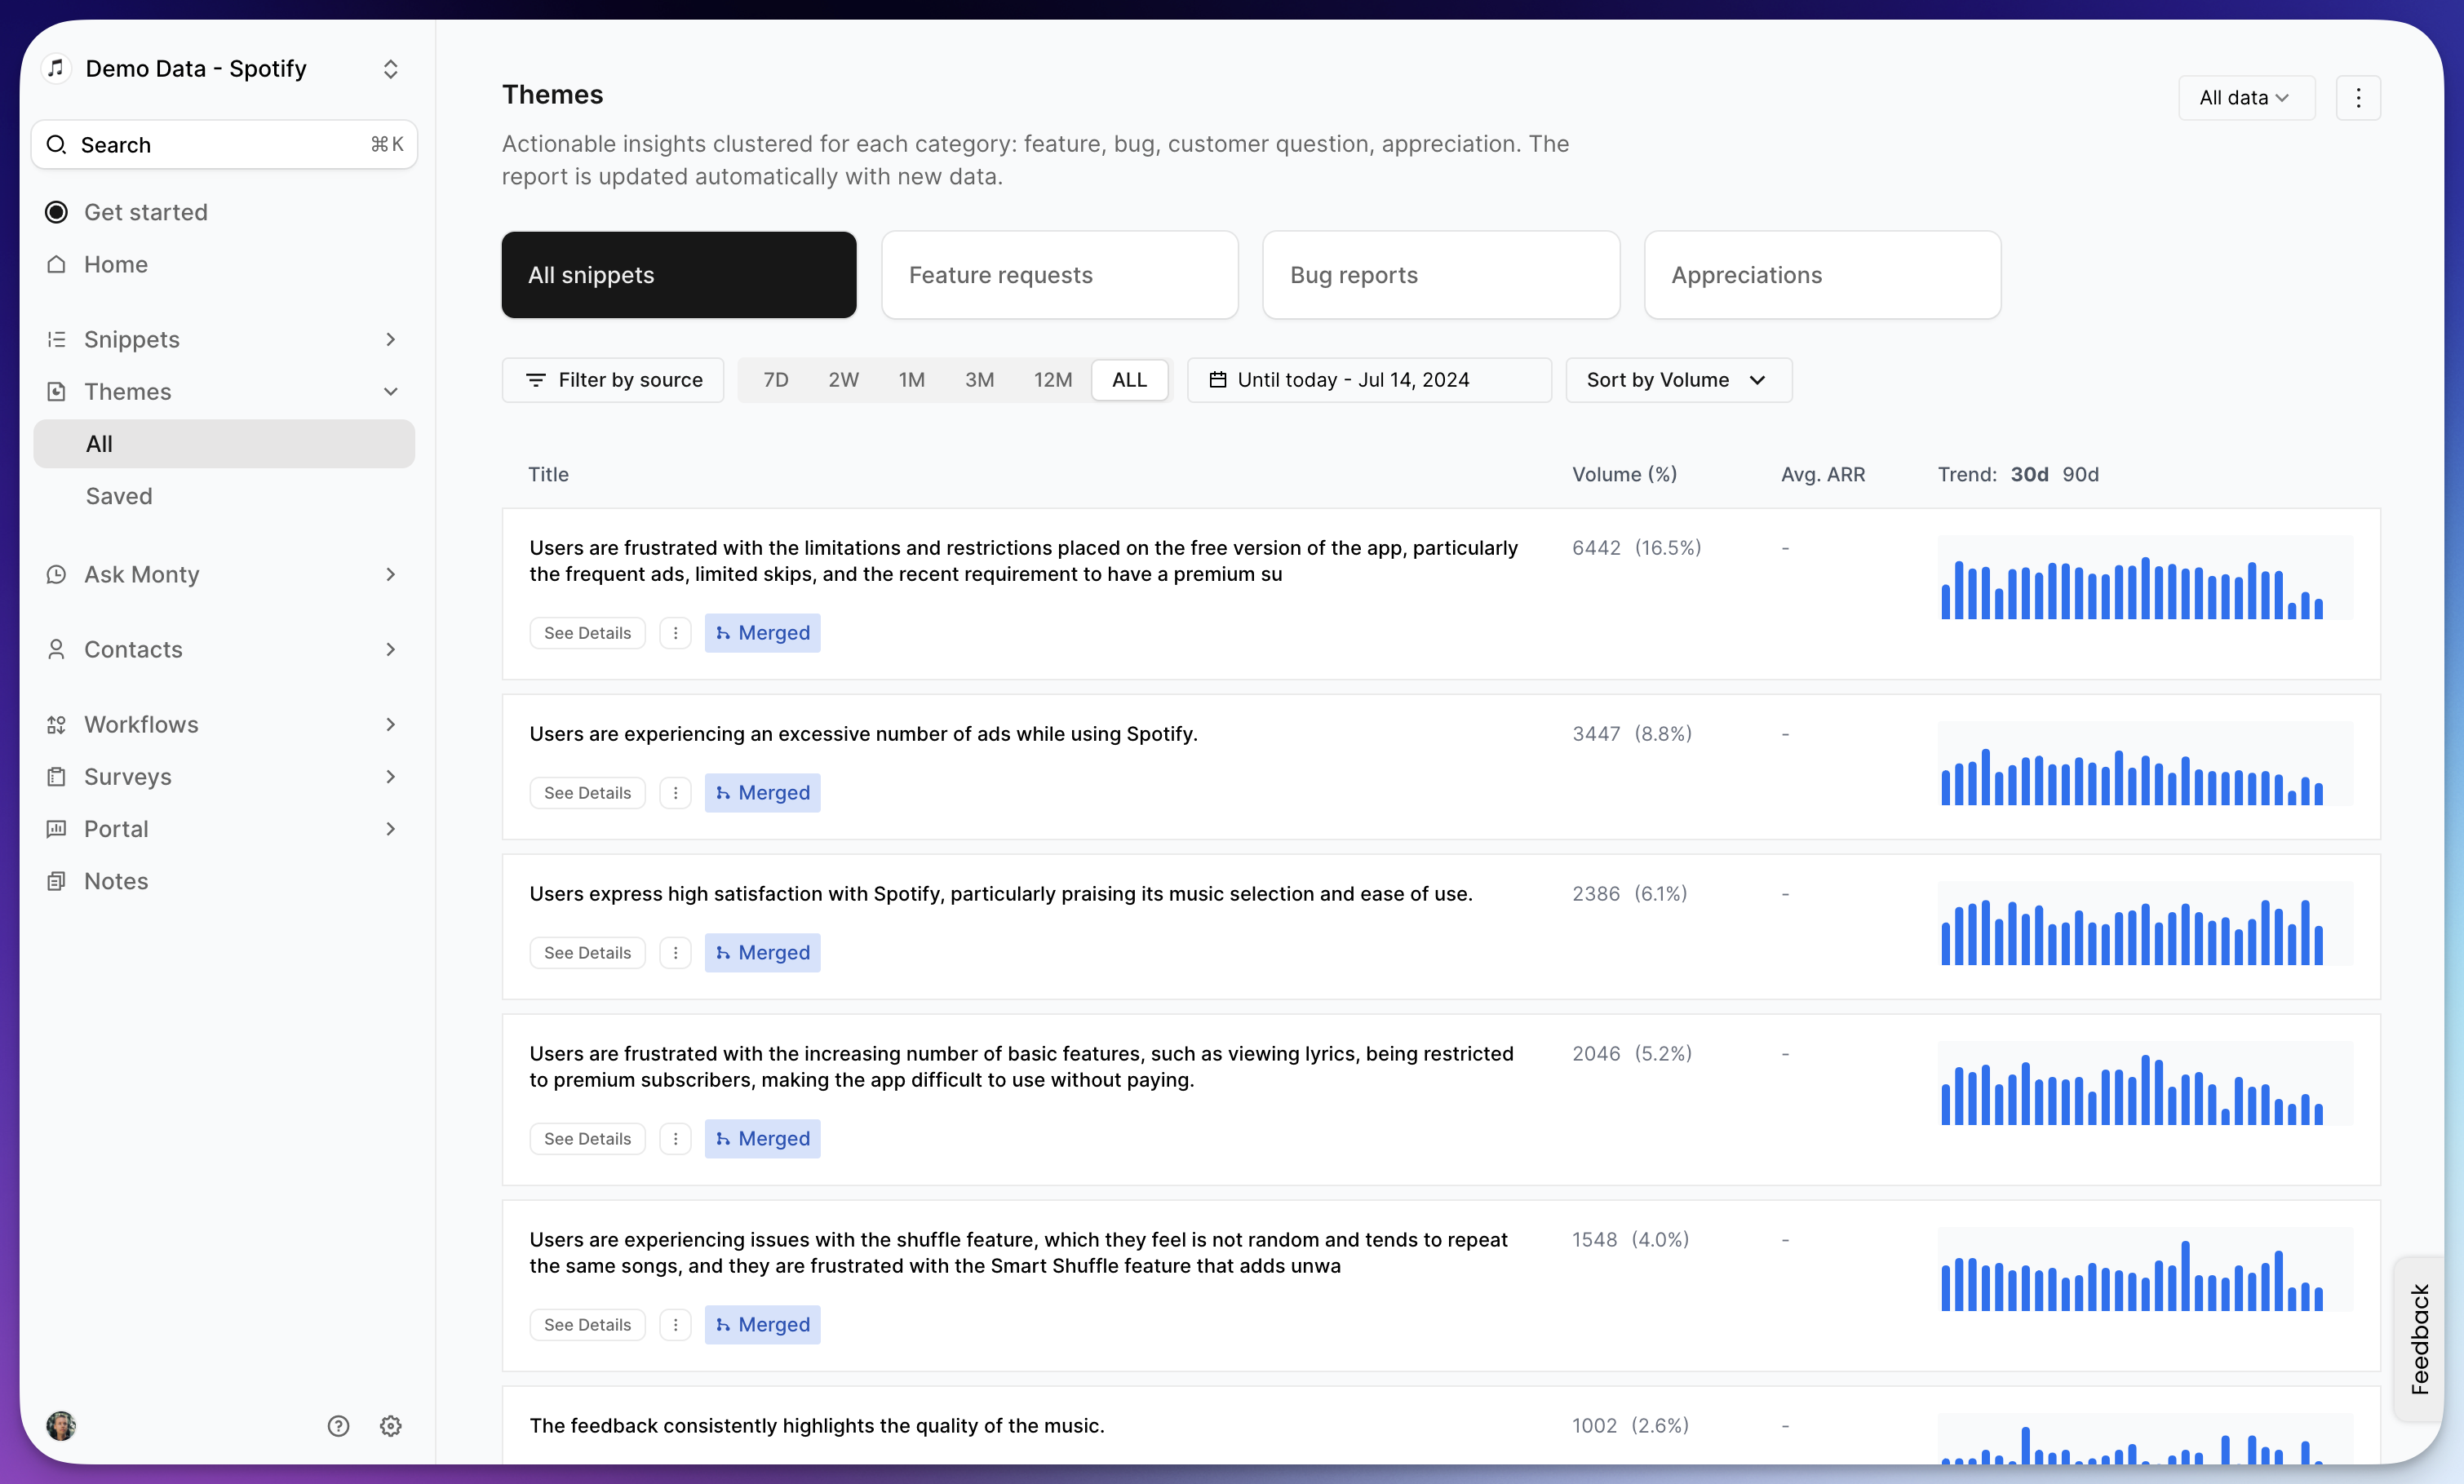
The Themes List is the default view when you navigate to “Themes” via the navigation menu. This view shows you a list of themes, each with a brief description of the theme, the volume of feedback that matches the theme, the percentage of total feedback that matches the theme, and the average ARR change associated with the theme. Each theme you see contains feedback with some commonality. For example, if you see a theme called “Users requesting dark mode”, it means that the feedback snippets in that theme mention dark mode, or something closely related. Sometimes themes can catch items that are not directly mentioned in the feedback, but are inferred by the system. For example, if you see a theme called “Users requesting dark mode”, it could also contain feedback snippets that mention “night mode” or “light mode”. Additionally, these themes by default are at a system-wide standard level of granularity. If you wish to customize this, you can reach out to the Reforge Insights team at support@monterey.ai and discuss your needs and work with us to tune this to them.Categories
Along the top of the Themes report page, you may see a list of category buttons next to “All snippets”. These categories are a way to filter the themes by a specific category. When applying one of these filters, it will only show themes made up primarily of items matching that selected category. For example, you might have a theme like “Issues with logging in” which is likely made up primarily of Bug reports. This theme will show when “All snippets” is selected, or when “Bug reports” is selected, but not when “Feature requests” is selected.Other Filters
There are a few other filters available to help you narrow down the themes you’re looking at:- Source: Understand feedback trends from specific channels or platforms.
- Date Range: Narrow down themes based on specific time frames, such as monthly or quarterly trends, to understand the evolving nature of user feedback.