How Monty Processes Your Questions
Behind every response, Monty follows a consistent workflow. It starts by parsing your question to understand what type of answer you need, what subject to focus on, and what constraints to apply. This interpretation phase determines whether you get a summary, chart, examples, or document. Next, Monty builds focused datasets—filtered collections of feedback that match your criteria. These datasets appear as cards above the response, showing their name, applied filters, and snippet count. For comparative questions like “Compare iOS vs Android feedback on performance”, Monty creates multiple datasets and analyzes them side-by-side. You can view and export the data returned in each dataset without leaving the chat session, just click the three dots to the right of each dataset to view the options.
Response Types
Ask Monty provides different types of responses depending on your question. Understanding these response types will help you get the most value from your analysis.Text Responses
When you need to understand themes, patterns, or qualitative insights, Monty provides written analysis in natural language. These text responses excel at synthesizing complex information and comparing segments qualitatively, giving you high-level overviews that connect the dots across your feedback. Ask questions like “Summarize the main complaints about our checkout process” or “What are users saying about the new dashboard?” to get these narrative responses. They work particularly well for comparing segments: “Compare feedback about design from iOS vs Android.”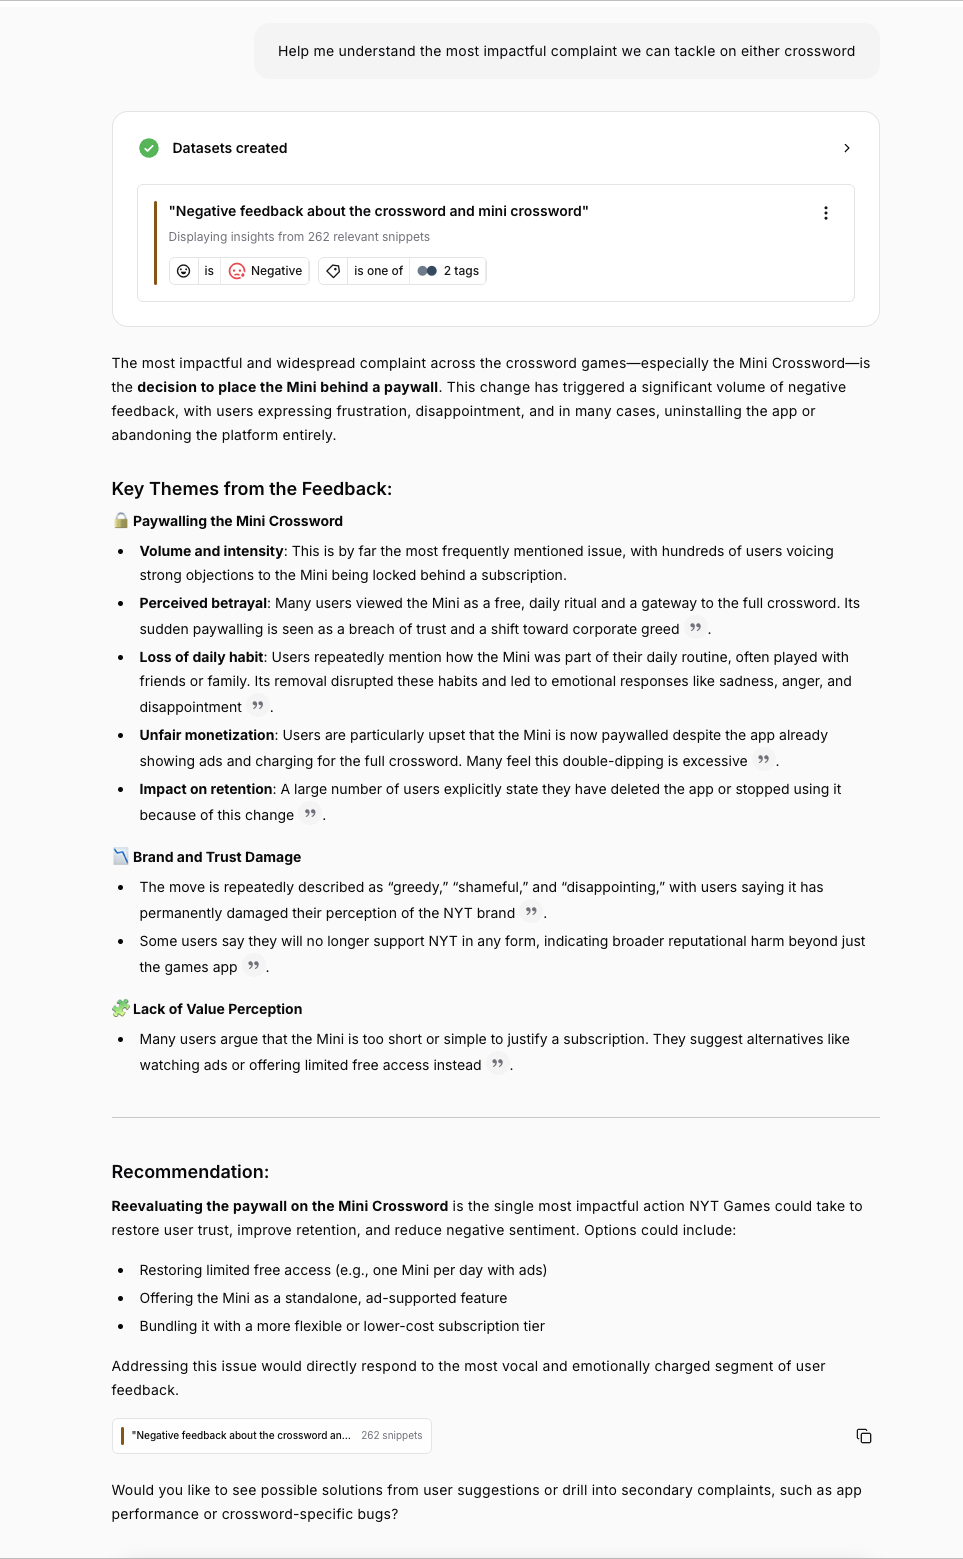
Charts & Visualizations
Visualizations reveal patterns that might be invisible in text. Charts excel at showing trends over time, comparing volumes across categories, and spotting peaks or unusual distributions. When you need to see the shape of your data rather than just understand its content, ask for a chart. Questions like “Plot feature requests over the last 6 months” or “Chart bug reports by category” trigger visual responses. Charts answer “how many” and “how much” questions that text summaries can’t easily convey.Chart Types
Monty automatically selects the right chart type for your question if it will help answer your question best. Bar charts handle categorical comparisons—how many bugs by category, feedback counts by source, or feature requests across projects. They’re versatile and can show multiple dimensions simultaneously, like sentiment grouped by source.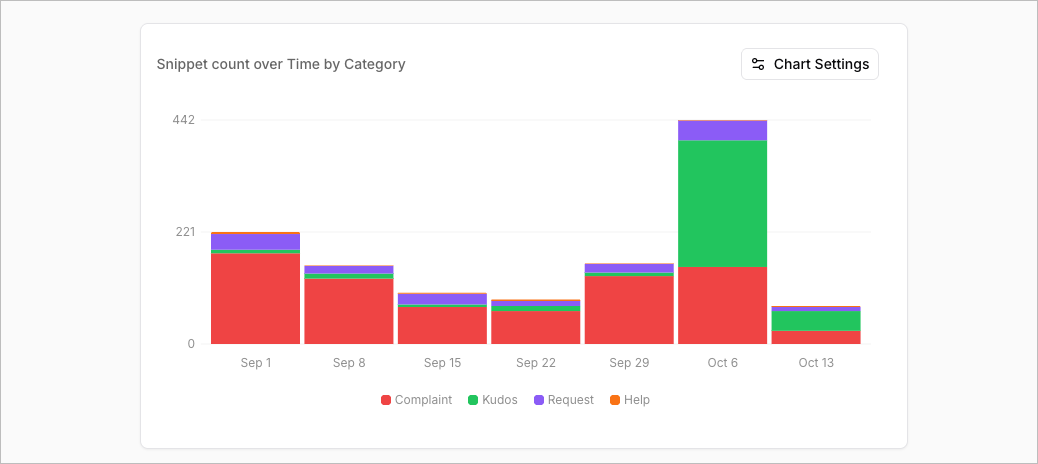
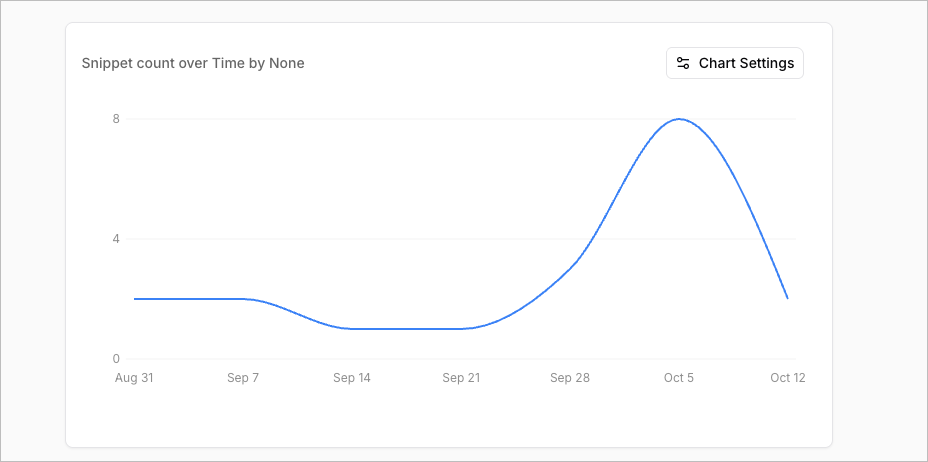
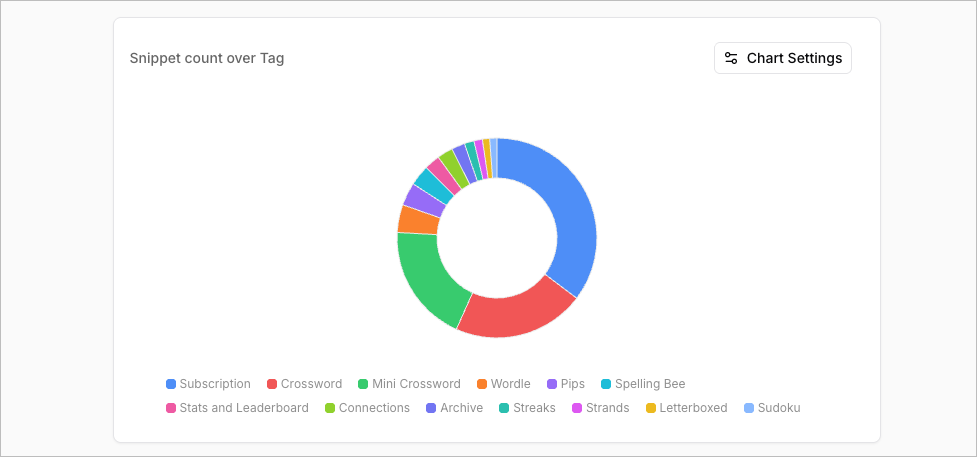
Chart Dimensions
You can chart feedback across various dimensions. Time is the most common, with Monty automatically selecting appropriate intervals—daily for short periods, weekly for one to three months, and monthly for quarterly or yearly views. The longer your timespan, the coarser the interval should be to keep charts readable. Sentiment breaks feedback into positive, neutral, and negative, letting you see emotional tone distributions or how sentiment evolves over time. Source reveals where feedback comes from—app stores, email, chat platforms, surveys, or custom channels—helping you understand your primary feedback channels. Categories organize feedback by topic classification like bug reports, feature requests, user experience, performance, or billing. If you’ve configured project areas, you can chart by project to see which product areas generate the most feedback. Tags provide more granular analysis of specific topics beyond broad categories. Chart tag frequency over time to spot emerging themes, or see which tags appear most often. Metadata dimensions let you slice data by custom fields like app version, platform, plan tier, user type, or any other properties you’ve configured. Monty can combine dimensions too—chart sentiment by source, or plot categories over time. This multi-dimensional analysis reveals patterns that single-dimension views might miss.Working with Charts
Match your question to the appropriate dimension. Time analysis needs date-based charts; source comparison needs source dimensions; topic analysis needs categories. Being explicit about what you want prevents ambiguity. Specify time intervals when precision matters. “Plot daily feedback volume for the past 30 days” is clearer than “Show feedback over time,” and produces results that match your expectations. Remember that charts are quantitative tools. They answer “how many” and “how much,” not “why” or “what are people saying.” For qualitative insights, follow charts with text analysis: first chart the top categories to see volumes, then summarize what each category contains to understand the content. Charts and text analysis work best together. Start with a chart to quantify the landscape, then ask for a summary to understand what’s driving the patterns you see. Comparison queries automatically create multiple datasets shown on the same chart, making differences immediately obvious.Feedback Examples
Sometimes you need the actual words customers used, not an interpretation. When you ask for examples—“List 10 examples of feedback about dark mode” or “Find snippets mentioning ‘confusing’“—Monty surfaces relevant quotes and snippets directly from your feedback. These lists let you verify themes from summaries, understand the exact language customers use, and find compelling examples to share with your team. Each snippet shows its source and date, and you can click through to see the complete feedback item with full context.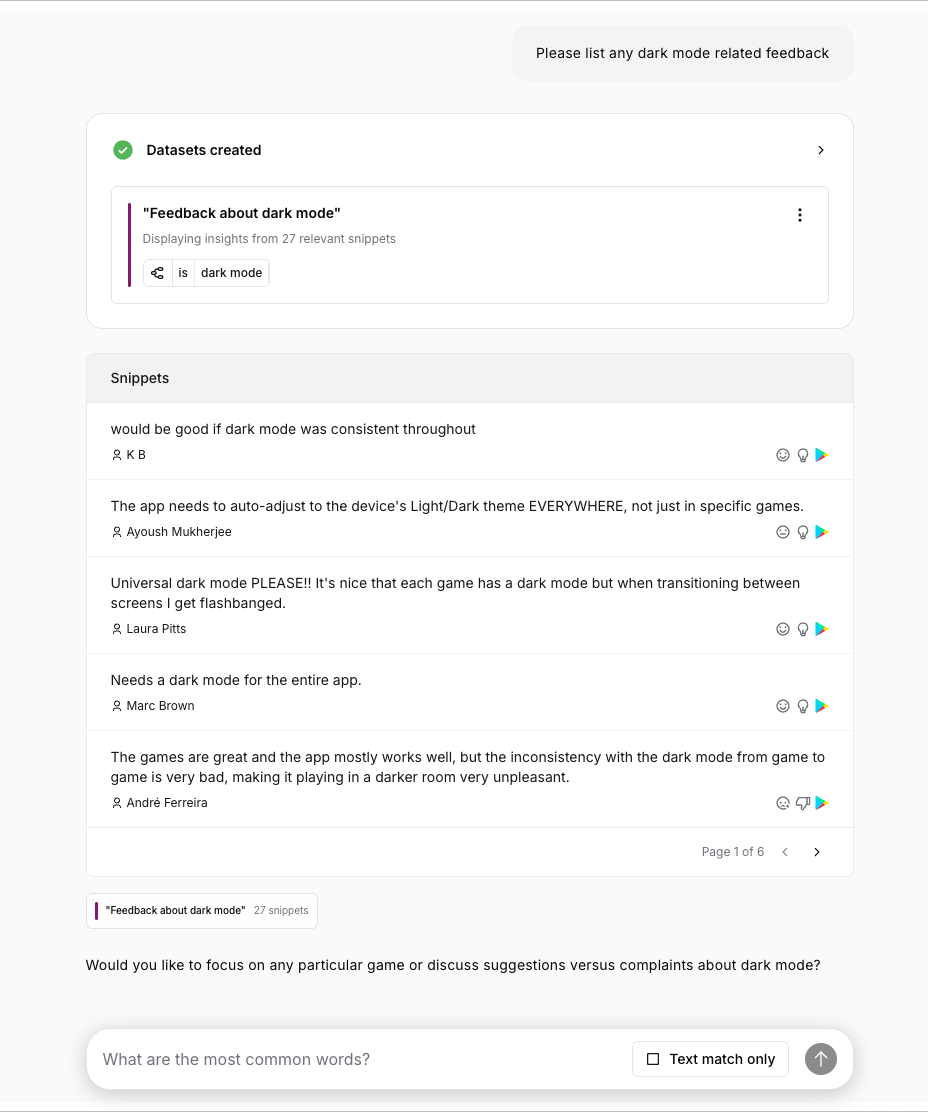
Documents
For structured deliverables, Monty can generate documents like PRDs, executive reports, or stakeholder summaries directly from your analysis. Ask “Create a PRD for the most requested features” or “Generate a report on Q4 customer feedback themes” to produce a formatted document based on your conversation. Documents open in a separate drafting interface where you can refine and edit the content. They remain linked to the original chat, preserving the research context behind each section. This makes them ideal for turning your analysis into artifacts your team can act on.
Next: Working with Datasets →